
Four Pixels
On 22 February 2026, Oldenburg voted on whether to repeal its tree protection bylaw. 60.58 percent of those voting said yes. The bylaw stayed in force nonetheless: for a referendum to be binding in Lower Saxony, at least 20 percent of all eligible voters must vote yes. About 4,500 votes were missing.
At the core of the dispute stands a sentence that sounds as if you could measure it. The initiative writes: “There is no verifiable loss of tree stock and green volume in the city of Oldenburg.” (Our translation.)
That is a claim about checkable data, and that makes me curious. So I look — with what works from a distance: satellite imagery, aerial imagery, open geodata.
700 km Seeing
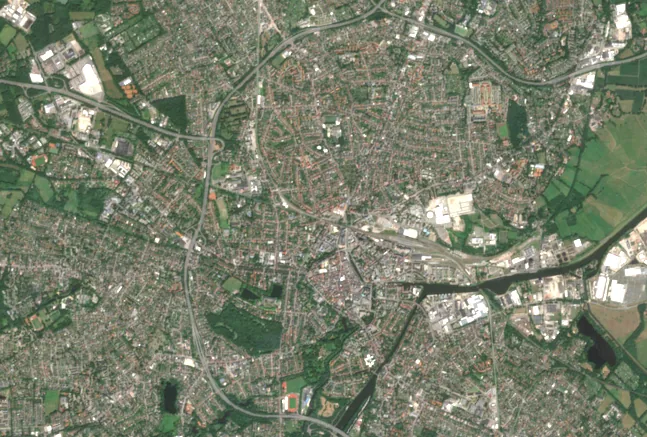
From orbit, Oldenburg is a pattern: we see history and development, cast into a temporary image. The satellite knows no addresses and no owners, only surfaces reflecting light according to what they are made of.
20 m Exploring
So let's ask differently: does a pixel lose green mass over the years? Eight summers, 2018 to 2025, and a straight line laid through every pixel. Behind it are 308 satellite passes — between 36 and 53 per summer — from which one cloud-cleaned mean image per year is built. What remains is not a snapshot but a direction.
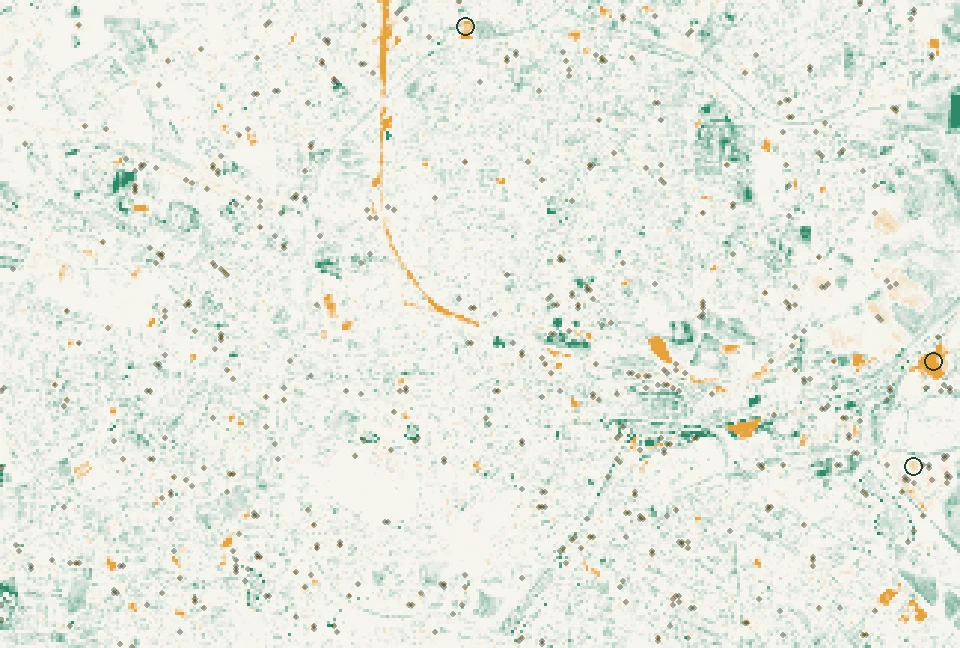
Change per year, in NDVI points
- From 0.02 loss per year I count a cell as falling; from 2018 to 2025 that adds up to at least 0.14 NDVI points.
- Green means: gaining green mass. In Oldenburg that is the rule, not the exception.
- Slopes below ±0.005 per year stay uncoloured — beneath the noise, the map shows no direction.
- Circle: a find — at least 0.16 hectares, formerly green, with a falling line across the eight summers.
- Pale dots: hints below the evidence threshold (single cells — could be noise or registration offset). They enter no figure.
The colour scale is clipped at ±0.05 per year in this rendering; stronger change carries the same end colour.
The first thing you notice: where the map shows colour at all, it is mostly green. Oldenburg is getting greener — in the built-up area by 0.006 NDVI points per year, and two and a half times as much area is rising as falling (7.8 against 3.1 percent). Outside town it is almost the same picture. That is the news a two-week comparison could never have shown.
And yet: eleven places in the built-up area are losing green across the eight summers. Not loud, not large, but directional: the same cell, eight summers, one falling line. Whether every single year sat below the one before is not what the calculation demands — only that the direction holds. The largest find covers one hectare in the south-east of the city and falls from 0.85 to 0.70; the steepest lies at the Heidenwall, from 0.64 to 0.22.
What disappears along the way is the noise: mowing, harvest, one dry July. Whatever returns every year averages out of a straight line. Of the twenty strongest finds of the current two-week analysis (29 July to 12 August 2026; map passport below), only two sit with their centre on a falling trend cell.
Resolution What the method can detect
Before I say anything about trees, I need to know what my grid can see at all. Three routes that check one another.
First, the ground noise. Measured on the two-week anomaly — the calculation this analysis began with (map passport below) — because the scatter reads off cleanly there: across 72,403 quiet cells it scatters by 0.037 NDVI points. My threshold of 0.10 is thus only 2.7 times that; one in twenty quiet cells slips below it by chance alone. A single cell therefore does not say much. Only four connected pixels push chance hits below one, across the whole city area. The four in the title is therefore not a metaphor but this chosen limit.
Second, dilution. An object smaller than the cell colours it only in proportion. From the ratio of object area to cell area follows how large a loss of vegetation has to be at minimum to break the threshold:
| Grid | smallest area | equals crowns |
|---|---|---|
| 10 m | 73 m² | 0.9 |
| 20 m · this method | 291 m² | 3.7 |
| 30 m · Landsat | 655 m² | 8.3 |
| 100 m | 7,273 m² | 93 |
| 1,000 m · climate grid | 727,273 m² | 9,265 |
That answers the question from the start: a felling becomes traceable from about four mature trees, not below. A single tree would stay borderline even at ten metres, and I do not have that resolution for the year-on-year comparison anyway. For larger areas, though, the same method is very sensitive.
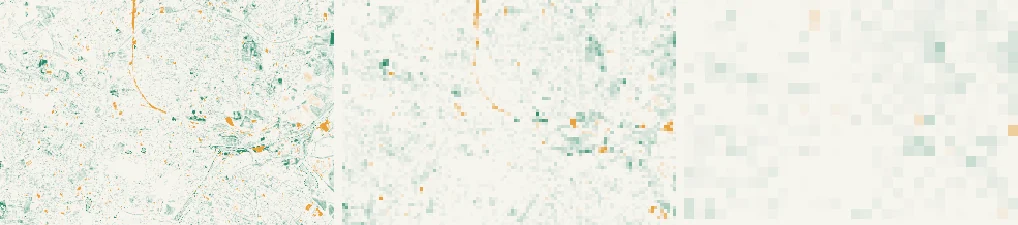
Third, the cross-check against the real image. The same trend, averaged step by step onto coarser grids:
| Grid | Share declining | Finds | Minimum area per find |
|---|---|---|---|
| 20 m | 2.4 % | 246 | 1,600 m² |
| 60 m | 1.4 % | 21 | 14,400 m² |
| 200 m | 0.8 % | 0 | 160,000 m² |
The same city, the same eight summers, the same raw data — and depending on resolution, 2.4 or 0.8 percent of its area is falling. Of 246 finds, at 200 metres not a single one remains.
A percentage without its grid (resolution) and without a spatial boundary is therefore worthless. And what a city loses in green, it mostly loses in small pieces. Small pieces are exactly what a coarse sensor averages away.
So the dispute is not settled — it has moved a little. Both sides can take the same raw data and arrive at different results without either of them lying… it is enough to look at different grain. Whoever counts coarsely sees a city that loses almost nothing. Whoever counts finely sees 246 places. Both are the same eight summers.
That is why the first question to ask of any number is not "is it right" but "against what was it measured". The monitor behind this stands open on my pages, in the layer explorer, with data quality, persistence and raw data. Anyone may recheck.
See for yourself
Check this episode's vegetation index in the NDVI monitor · overlay the open map services in the scene explorer · look up source and licence of every layer in the connector catalogue (interfaces in German).
100 m Checking
That leaves the question of what is behind the eleven finds. For this, the aerial image — 20 centimetres per pixel, each place one by one.
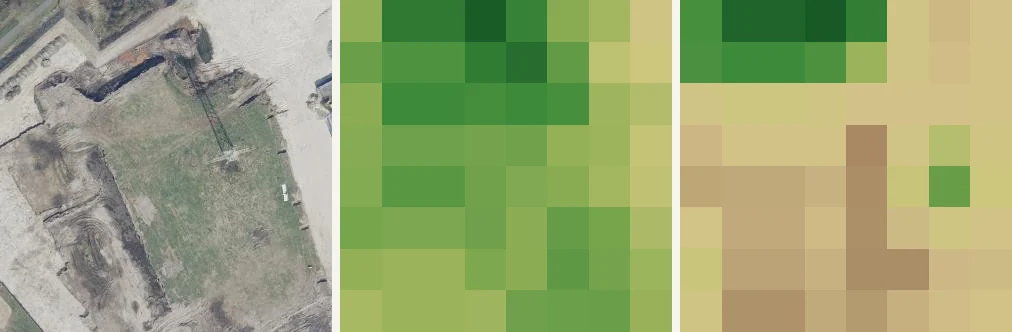
NDVI — how much living foliage per pixel
Depending on wavelength and sensor, a pixel spans anything from several metres down to centimetres. Within these "windows" the NDVI measures green mass — biomass ready for photosynthesis. The actual cause of a rising or falling NDVI is, by itself, still not fully settled at that point: felling, construction, mowing, drought stress?
It holds up: at the Heidenwall lies excavated ground next to machinery. A real decline — the area was green and no longer is. Only it is earthworks, not a felled garden tree. Elsewhere in the ranking, too, stand construction sites, demolition and cleared areas, plus a meadow and a field; what the bylaw protects — the single tree behind the house — appears in none of the eleven finds.
And one area tells why the long series is strict: the cleared railway land at the Braker Bahn, one of the steepest finds of the first calculation, stays green through 2023 (0.70 to 0.76) and collapses to 0.13 in 2024. Across eight summers, that one break thins out to a slope at the threshold — as a find, the area no longer appears. An event is not a trend.
And for exactly this question the aerial image stays blind. It dates from 6 April 2023 — three years older than the last summer in the trend, and flown before leaf-out. On an April image every deciduous tree is bare. The picture that would have to show a loss of crowns is unsuited for precisely that.
Context What does a tree actually weigh?
… and why does this matter at all? Suppose a tree had really disappeared there. A small-leaved lime, measured, transpires up to eight litres an hour and thereby cools with 2.3 kilowatts. Under its crown the asphalt is up to 20 °C cooler. The air, though, only by two.
And right there it gets interesting: two degrees sound negligible in this example. Yet whoever walks home from the bus stop in summer notices immediately whether the path lies in shade.
What disappears from above is a numeric value. What disappears below is shade on a path, a sound, a line of sight, the spot where you always stop for a moment. No pixel of this analysis will ever show it. It is still what people mean when they say it has become barer.
Replacement is therefore not an arithmetic of head counts but of years: the same lime delivers about 3,300 kilowatt-hours of cooling at age 20, ten times that at 80. A protected tree on compacted soil without water is protected — and ineffective all the same.
And the city — surveyed, then, with different approaches. The bylaw's supporters reckon with 15.9 percent tree canopy cover. The Hitze-Check 2026 of Deutsche Umwelthilfe counts Oldenburg at 32.33 percent among the seven German cities above the 30-percent mark. What is counted there, however, is all vegetation above 2.5 metres, relative to the settlement area only. The same city, once a laggard, once a model pupil: depending on what you count and what you divide it by. Both sources are listed below.
0 m The first step
What this is aboutthe difference between measuring and opining.
What stands in the waythat both sides have the same comparable basis.
The first steptracing both numbers back until it lies open what they count — and what nobody counted in the 27 years without a bylaw.
From 1998 to July 2025, Oldenburg has no tree protection bylaw. 27 years in which it should have become visible whether a city without a bylaw loses its trees. A time series of crown cover across those 27 years would decide the dispute. It is nowhere to be found publicly. The city's green master plan lists a digital tree register as a project to this day.
It could be reconstructed: aerial imagery reaches back further than satellite series, and the city has it. That is another request — suited for a sequel.
What remains open from a distance
Three things I cannot do, and more computing time changes none of them.
The single case. What is behind one individual find is known by someone who lives there. No dataset ultimately knows it for certain. The decline can be measured and assessed reproducibly — the cause not always, and the difference between the two explains the whole span of the dispute.
The cause in this case. NDVI does not separate felling, construction, mowing and drought stress. Any attribution drawn from this report would be an assertion, not an observation.
The time before. Sentinel-2 does not reach back to 1998. Without the series across the bylaw-free years, the core question of the vote — does a city without a bylaw lose trees? — remains unanswered.
The next step is therefore not one you can compute. Go there, ask, look. Given interest, that will become a site visit of its own in Das Feldbuch. Until then, this page holds what can be substantiated from above… and what does not follow from it either. How much certainty do decisions need before they are taken? What follows as a consequence?
Methods & sources
The methods behind this episode are explained on the Das-Feldbuch methods page, each with its reasoning and limits. Here are the parameters of this analysis, so that every run can be repeated without guessing. Analysis grid of all evaluations: 20 m, WGS 84 / UTM 32N (EPSG:32632), every cell exactly 400 m²; only the top-down view is a true-colour image on the native 10-m grid. All raw data was retrieved on 12 August 2026 via the Copernicus Data Space Ecosystem; licence wording: Contains modified Copernicus Sentinel data 2018–2026. The first calculation of 9 August ran on an approximate geographic grid; its areas were thereby underestimated by about one percent. All analysis scripts and data files of this episode live versioned on GitHub: github.com/retteten/fieldbook-code — the paths in the map passports are paths in that repository, and every call can be repeated there unchanged (code and comments in German).
The trend, named precisely. "A straight line laid through every pixel" means: per cell the Theil–Sen slope — the median of the slopes of all year pairs — across the summer composites 2018 to 2025, tested with the Mann–Kendall test (significance level 0.05). This slope does not tip when a single drought summer falls out of line; an ordinary least-squares line would — which is exactly why starting the series in the drought year 2018 is harmless. The series starts in 2018 because both Sentinel-2 satellites have been flying since then (five-day revisit); the first calculation used 2020 to 2025, a start without a substantive reason that needlessly weakened the test: with six years, Mann–Kendall reaches the 0.05 level only at near-perfect monotony (|S| ≥ 13 of 15 year pairs); with eight years, 18 of 28 suffice. In all honesty: the test remains strict even now. In the built-up area 26 percent of cells reach significance (increases included); of the eleven finds, one stays below the threshold with the median of its cells (p 0.035), the others sit between 0.11 and 0.54. The burden of proof therefore still rests on the rule of four connected cells, not on the test; with tens of thousands of cells tested at once and a possibly autocorrelated series, anything else would be feigned precision. Methods: slope estimator after Sen (1968), trend test after Mann (1945) and Kendall (1975, Rank Correlation Methods); hands-on in Helsel et al., Statistical Methods in Water Resources (USGS 2020), ch. 12.
The built-up mask and its sensitivity. "Built-up" here means: within a 250-m radius the multi-year seasonal normal sits below 0.55. That is a makeshift derived from the data itself, not an official imperviousness layer, and the parameter shifts the result noticeably. In the old rasterisation of the first calculation (geographic grid) the same data gave, with the 250 m/0.55 mask, a built-up area of 28.81 km² and 6.7 percent decline; with the tighter 150 m/0.48 mask only 9.68 km² and 6.0 percent (persistent loss 2.42 against 3.13 percent). Showing only one of the two rows would mislead — which is why both stand here.
Map passport, top-down view: Sentinel-2 L2A via the
Processing API of the Copernicus Data Space Ecosystem · true-colour
median 28 June to 12 August 2026 (the script's 45-day window) ·
native 10-m grid, WGS 84 / UTM 32N (EPSG:32632) · no analysis, tone
curve only · produced on 12 August 2026 with
python scripts/ortstermin/folge_bilder.py --slug vier-pixel
                   --lat 53.1462 --lon 8.2108
.
Map passport, two-week comparison: Sentinel-2 L2A ·
cloud-cleaned median 29 July to 12 August 2026 (8 passes within the
window) against a
day-matched window baseline of the years 2020 to 2025, multi-year
comparison against the summer composite 2021 · analysis grid 20 m,
WGS 84 / UTM 32N (EPSG:32632) · thresholds: anomaly ≤ −0.10 (2.7 σ
of the ground noise, see map passport "scale check"), multi-year
difference ≤ −0.15, formerly green ≥ 0.55, at least four connected
cells, built-up mask 250 m/0.55 · processed on 12 August 2026 with
python scripts/ortstermin/ndvi_fundstellen.py --aoi oldenburg
                   --referenzjahr 2021 --bbox 8.155,53.105,8.285,53.185 --json
                   docs/daten/fundstellen-oldenburg-2026-W33.json
· data:
docs/daten/fundstellen-oldenburg-2026-W33.json ·
observations per cell: 1 to 7, median 4. Result: 89 finds, the
twenty largest listed; two of them sit with their centre on a
falling trend cell (a point probe per find, not an area
comparison).
Map passport, trend: Sentinel-2 L2A · peak-season
composites of the years 2018 to 2025 (ISO weeks 23 to 35) ·
satellite passes per summer window: 37 · 36 · 37 · 36 · 37 · 36 ·
36 · 53 (2025 including Sentinel-2C), 308 in total — counted on
13 August 2026 in the public CDSE catalogue with
python scripts/ortstermin/szenen_zaehlen.py --aoi oldenburg
                   --trend docs/daten/trend-oldenburg-2018-2025.json
                   --fundstellen docs/daten/fundstellen-oldenburg-2026-W33.json
                   --json docs/daten/szenen-oldenburg-2018-2026.json
, data:
docs/daten/szenen-oldenburg-2018-2026.json ·
Theil–Sen slope per cell, Mann–Kendall test (significance level
0.05) · analysis grid 20 m, WGS 84 / UTM 32N (EPSG:32632) ·
thresholds: falling from 0.02 loss per year, at least four connected
cells, formerly green ≥ 0.55, built-up mask 250 m/0.55 · processed
on 12 August 2026 with
python scripts/ortstermin/ndvi_trend.py --aoi oldenburg --bbox
                   8.155,53.105,8.285,53.185 --jahre 2018,2019,2020,2021,2022,2023,2024,2025
                   --vergleich docs/daten/fundstellen-oldenburg-2026-W33.json --json
                   docs/daten/trend-oldenburg-2018-2025.json
· data:
docs/daten/trend-oldenburg-2018-2025.json ·
observations per cell: 2 to 22, median 11. Map image:
python scripts/ortstermin/fundstellen_karte.py --was karte
                   --quelle trend --json docs/daten/trend-oldenburg-2018-2025.json
                   --jahre 2018,2019,2020,2021,2022,2023,2024,2025
                   --ausschnitt 8.162872,53.126906,8.258728,53.165494 --spanne 0.05
                   --markiere 20 --breite-px 960
· rendering: slopes below
±0.005 per year stay uncoloured (noise core, 10 % of the span),
after which the ramp rises gently (exponent 1.2); raster series:
same call with
--was raster-reihe --faktoren 1,3,10 --breite-px 1018;
triptych tiles (find 2, 150-m edge):
--was dreiklang --nr 2 --referenzjahr 2018 --kante-m 150
                   --breite-px 1020
. Aerial tile therein: LGLN DOP20, survey
flight 6 April 2023, edition 2023, retrieved 12 August 2026. The
first calculation over 2020–2025 remains archived as
trend-oldenburg-2020-2025.json.
Map passport, scale check: an arithmetic check on
the same data · ground noise of the two-week anomaly across 72,403
quiet cells: robust scatter 0.037 NDVI points, so the 0.10 threshold
sits at 2.7 σ · dilution calculated for the jump from dense canopy
to open ground (NDVI difference 0.55) · processed on
12 August 2026 with python scripts/ortstermin/skalenprobe.py
--aoi oldenburg --bbox 8.155,53.105,8.285,53.185 --json
docs/daten/skalenprobe-oldenburg-2026-W33.json · data:
docs/daten/skalenprobe-oldenburg-2026-W33.json.
- Referendum of 22 February 2026, official final result of 24 February 2026: 22,560 yes (60.58 %), 14,682 no (39.42 %), turnout 27.24 %; approval quorum of 20 % of the 135,173 eligible voters = 27,035 yes votes, not reached. Legal basis § 33 NKomVG.
- Bylaw for the protection, preservation, care and development of the tree stock in the city of Oldenburg (Oldb) of 30 June 2025, Ortsrecht 3.80, promulgated in official gazette no. 13 of 18 July 2025, in force since 19 July 2025; threshold and measuring height per § 2 (2) lit. a. The earlier bylaw of 1997 was repealed by referendum on 1 March 1998 (one municipal source names 11 March 1998).
- Quote of the citizens' initiative "MeinBaumOldenburg" from the call for the petition (2025); our translation.
- Own analysis: Sentinel-2 L2A via the Copernicus Data Space Ecosystem, two-week window 29 July–12 August 2026, trend across the summers 2018–2025, analysis grid 20 m, WGS 84 / UTM 32N (EPSG:32632). All methods, thresholds, script calls and data files in the section "Methods & sources" above; scripts and data versioned on GitHub. Contains modified Copernicus Sentinel data (2018–2026).
- Geospatial base data: © LGLN (2026) — digital orthophotos DOP20, CC BY 4.0, https://creativecommons.org/licenses/by/4.0/deed.en, excerpt, data modified. Most recently retrieved on 12 August 2026 via LGLN's open service (opendata.lgln.niedersachsen.de); survey flight 6 April 2023, edition 2023, ground resolution 20 centimetres. Place names from OpenStreetMap, © OpenStreetMap contributors, https://www.openstreetmap.org/copyright.
- Cooling capacity and replacement: measurements by TU Munich on small-leaved limes (summer 2015); model calculations of the CityTree II project; Erlwein, Zölch & Pauleit, Building and Environment 205 (2021), art. 108233; sensitivity to sealing and soil water from the CityTree II final report.
- Tree canopy cover, first value: 15.9 % — a figure from the city of Oldenburg, used by the bylaw's supporters in the referendum campaign; no published methodology (sensor, height threshold, reference area, survey year) exists. Documented via the press release of the Green council group of 18 February 2026 (with comparison values Hamburg 23, Göttingen 22, Osnabrück 19 %) and the Oldenburger Onlinezeitung ("according to the city"); both in German.
- Tree canopy cover, second value: Hitze-Check 2026 of Deutsche Umwelthilfe (analysis: LUP GmbH) — canopy-cover rate 2025 for Oldenburg 32.33 %: vegetation above 2.5 m height, relative to the settlement and transport area; seven of 195 cities sit above 30 %. The same study rates Oldenburg's sealing trend 2018–2025 of +0.52 points as red. Sources (in German): press release of 9 June 2026, city table (PDF, Oldenburg p. 6), methodology FAQ (PDF). The two canopy figures are defined differently and cannot be converted into one another — the comparison cities of the city's series (Hamburg 23 %) and the DUH series (Hamburg 30.99 %) show the definition gap directly.