
Three Hundred and Sixty Hectares
The Ammerland is the densest tree nursery landscape in Europe. In a district the size of Lake Constance, rhododendrons, conifers and hedging plants grow for half of Germany. The State Statistical Office counts them every four years.
In 2021 there are 160 holdings on 2,612 hectares. In 2025 there are 149 holdings on 2,252 hectares. Three hundred and sixty hectares fewer in four years, just under fourteen per cent.
Nobody has to guess how dry those years were. The German Weather Service publishes open monthly grids across the country: rainfall and potential evaporation, and from the two follows the water balance of a summer. Averaged over exactly this view, for every summer since 1991, that produces a clear ranking. 2018 is the driest, 2022 the second driest of 35. An ordinary summer here is 42 litres per square metre short. In 2022, 217 were missing; in 2018, 237. The soil says the same: in both summers it holds on average only about half of the plant-available water, in two of the reference years 72 and 79 per cent, in the third 59. The reference year 2025 is therefore the weakest of the three supports. The record summer of 2018, however, falls before the first count; only 2022 lies inside the window of the 360 hectares.
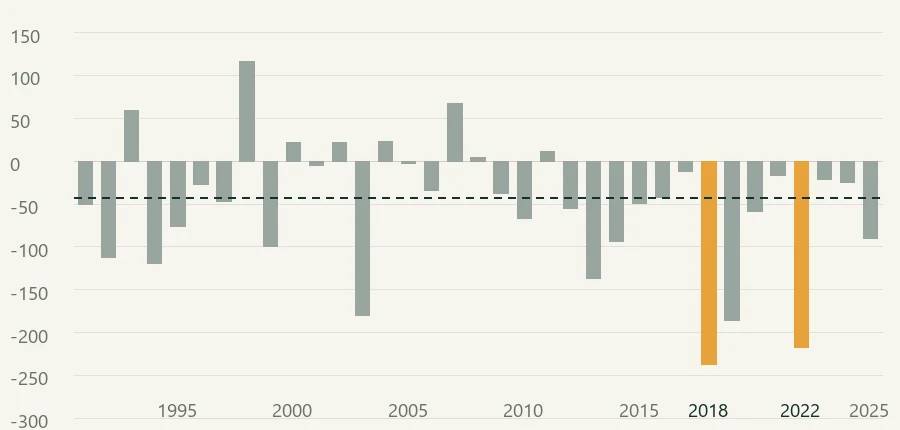
35 summers of water balance over the Ammerland
- the two drought summers of 2018 and 2022.
- all other summers since 1991.
- dashed: the median, −42 millimetres.
Climatic water balance from June to August: rainfall minus potential evaporation. Zero would mean that exactly as much evaporates as falls. One millimetre is one litre per square metre.
That makes the hunch even more obvious than it already was: the drought took them. So I look, with what can be done from a distance. Eight summers of Sentinel-2, one district, two indices. What happened on any single holding is not settled by that; for this I would have to go there, and that is still outstanding.
700 km Seeing
The first reflex when it comes to drought is the NDVI, the index that measures how green an area is. For this question it is the wrong tool, and for a reason that is easy to overlook: green is the slowest signal a plant sends. A leaf turns brown once it already has the matter behind it.
So I compute both. The NDVI measures the colour. The NDMI measures the water in the leaf itself: it uses the shortwave infrared, in which liquid water swallows light. As the tissue dries, reflectance rises there and the index falls, weeks before the colour stirs. Both from the same acquisitions, the same cloud mask, the same 20 metre grid.
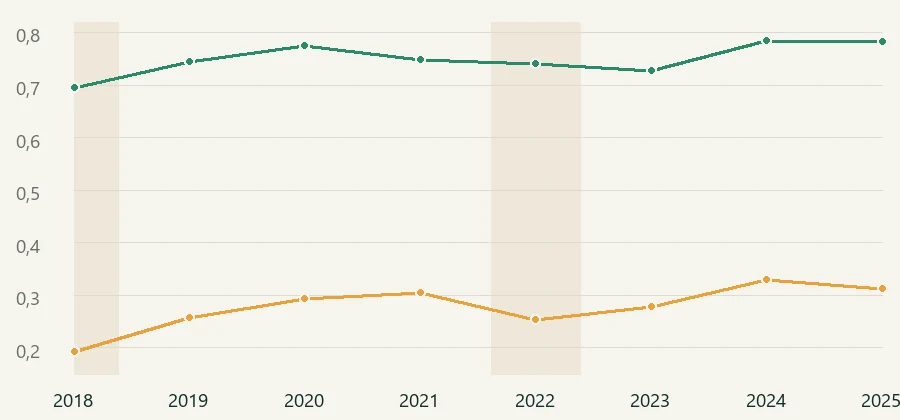
Eight summers over the same district
- NDVI: how green the landscape is. Upper line.
- NDMI: how much water sits in the leaf. Lower line.
- shaded: the two drought summers of 2018 and 2022.
Both indices run from −1 to +1 and are plotted on the same scale. Each point is the mean over the whole view, computed from the cloud-free median of weeks 23 to 35.
The drought summer of 2018 falls 0.054 points below the reference year 2021 in green. In water it falls by 0.113, a good twice as deep.
And then 2022. In green this summer sits at 0.742, the reference year 2021 at 0.749. Seven thousandths. Anyone looking only at the NDVI does not find the drought summer of 2022 over the Ammerland. In water it lies 0.051 below, seven times as far.
That is the first finding, and it has nothing to do with tree nurseries yet: a landscape can look green and be measurably dry. The colour lags behind.
20 m Exploring
Out of both indices together comes a map with four fields. For every pixel I compare the two drought summers with three unremarkable ones, 2021, 2024 and 2025, and ask twice: does the green fall? Does the water fall?
What counts as “falls” wants to be measured, not decreed. The yardstick for that is two unremarkable summers against each other: whatever differs between them is everything that orbit position, cloud residue, mowing dates and crop rotation do together. That spread is 0.075 NDVI points. I set the threshold at twice that. Four different pairs of years deliver between 0.056 and 0.076; I take the strictest.
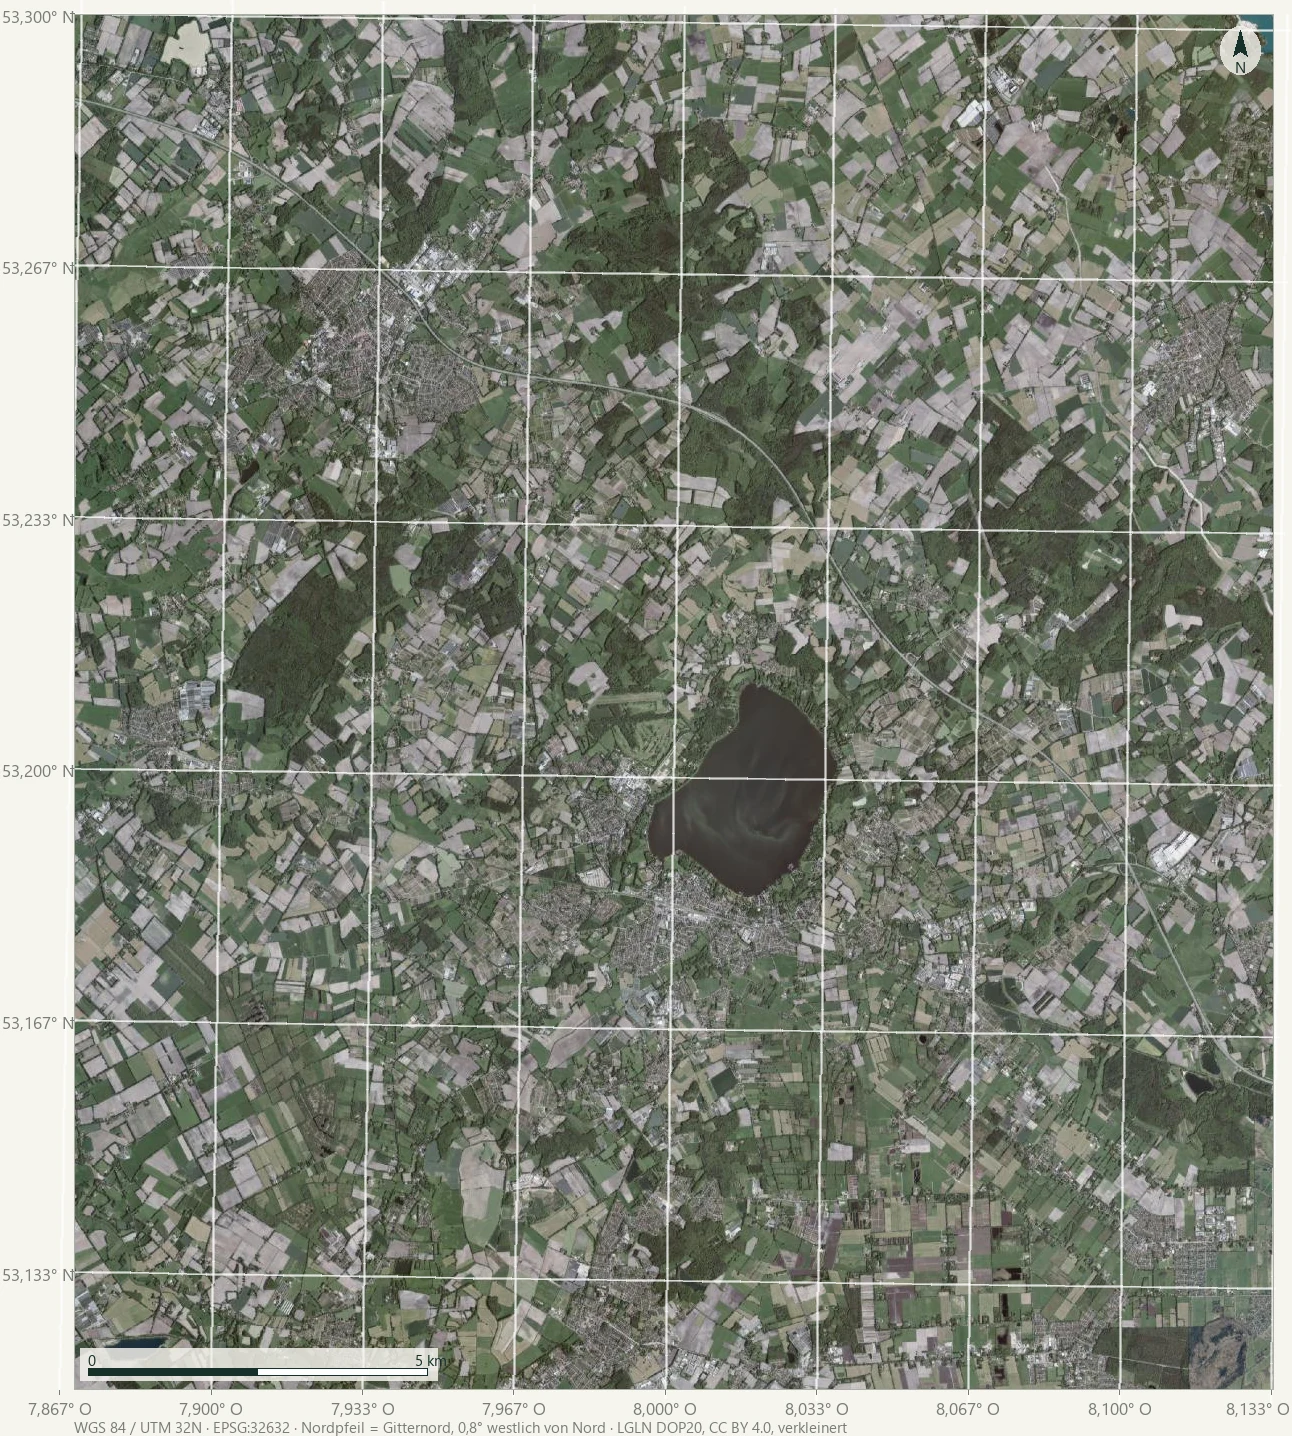
So that it is clear what those four colours are about to lie on top of, here is the view itself first. It is the same frame as the map below, line for line: anyone thinking both images on top of each other will find every conspicuous parcel again in the aerial photograph.
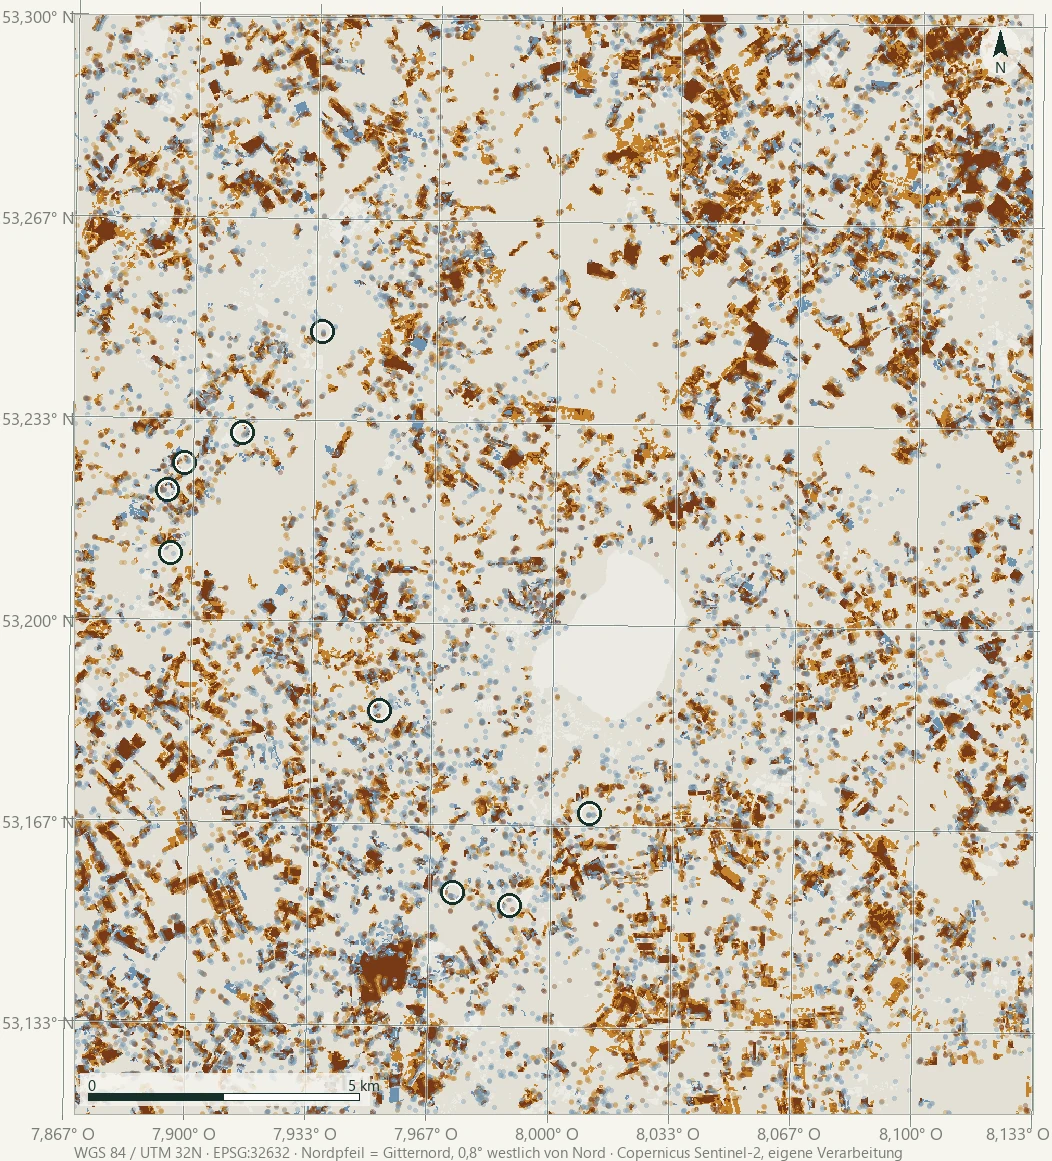
Two drought summers against three normal years
- no decline above the threshold, 78.6 % of the area.
- moisture falls, green does not: 6.8 %.
- green and moisture fall: 11.2 %.
- green falls, moisture does not: 3.4 %.
- pale dots: indications below the evidence threshold. Single cells that may be noise or registration offset. They enter no number.
- circle: a tree nursery block confirmed by hand in the aerial photograph.
The large pale class does not mean “there was enough water here”. It means: the decline stays below the threshold. That is a non-statement, and it is meant to look like one.
The map is legible: you can see parcels, field boundaries, the hedgebanks in between. 6.8 per cent of the area loses water without losing colour, which is 2,342 hectares. Of that, 1,536 hectares lie in 965 contiguous clusters of 0.48 hectares and larger, the rest in smaller patches below the evidence threshold.
Two thousand three hundred and forty-two hectares. The official tree nursery area of the district is 2,252. That is not a match, only the same order of magnitude. But it is the kind of proximity you get caught on. And precisely for that reason the next question has to come.
The gate: is this a tree nursery at all?
In “Four Pixels” a scale test stood before the analysis: is the object larger than the smallest area the grid can show? Here it is a different question, and on my first attempt I skipped it.
The satellite sees areas. It does not see businesses. Before a sentence about tree nurseries may be uttered, nursery land has to be separable from grassland.
The obvious move: rhododendrons and conifers are evergreen. In late winter, when the deciduous trees stand bare and the sun is high enough again, they ought to stand out. I fetch two such windows, 1 February to 20 March in 2021 and 2025, and look at the distribution.
One peak. No valley. The winter values of the whole view crowd around 0.57, without any dip where a boundary could sit. And the size test settles it: a threshold that would leave exactly the official hectare figure would have to sit at 0.758, that is, on the upper flank of that same single peak. A threshold there would be decreed, not measured.
That leaves the honest makeshift: look. Nine tree nursery blocks and nine grassland areas, each determined individually in the aerial photograph at 20 centimetres. A nursery block is recognisable there by three things that disappear completely at 20 metres: by the rows spaced a metre apart, by the rectangular blocks with turning strips, by the polytunnels and container areas next to them.
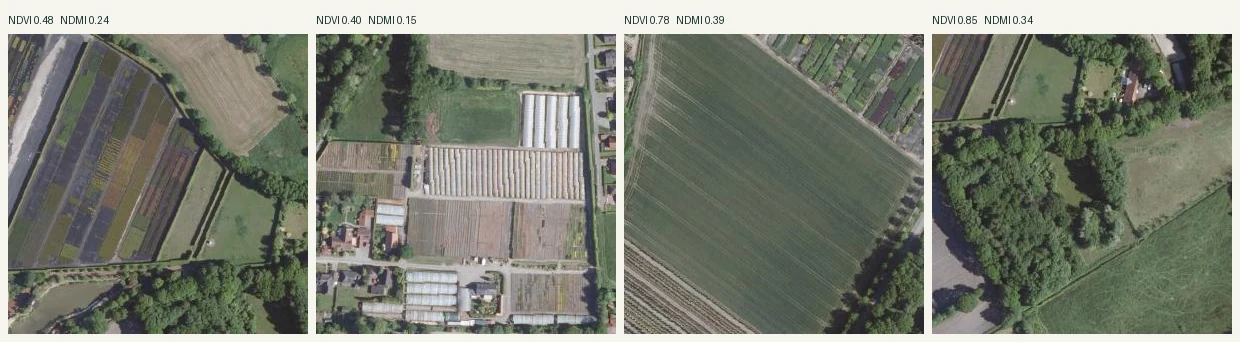
And now it gets interesting. In summer the tree nurseries are less green than the grassland: 0.592 against 0.775. No wonder: between the rows lies bare soil, and a 20 metre pixel averages it in. So there is a difference in the mean.
Only it is of no use. The greenest nursery point sits at 0.674, the palest grassland point at 0.610. The classes overlap, and what happens if you draw a threshold anyway can be calculated:
| Threshold | Area marked | Share | Of that nursery |
|---|---|---|---|
| below 0.60 | 4,783 ha | 13.9 % | at most 47 % |
| below 0.65 | 6,528 ha | 18.9 % | at most 35 % |
| below 0.70 | 9,084 ha | 26.3 % | at most 25 % |
The hectare figures in this table come from the first calculation on the geographic nominal grid; areas are therefore underestimated by about one per cent. It has not been recomputed. That does not change the order of magnitude of the finding.
At 0.70 all nine nurseries in the sample are inside. On the sample the threshold therefore looks perfect. On the map it marks a quarter of the district, while tree nurseries can account for at most 6.5 per cent. Three out of four hectares marked this way would not be a tree nursery.
That is not a programming error but a property of the problem: a handful of confirmed areas says nothing about how common the class is in the landscape at all. A method can be right on every sample and still be wrong for the majority of the map.
So the gate does not hold. The image alone does not make a tree nursery. If these areas are to be given a name, the name has to come from somewhere else.
100 m Testing
First, though, the attempt that fails, because it explains all the rest. Instead of inferring tree nurseries from the map, one can take the eighteen areas confirmed by hand and ask how they responded to the drought. In green the nursery blocks come through 0.031 points better than the grassland; in water they lie 0.012 behind. Both numbers are smaller than the noise: between two unremarkable summers the same pixel varies by 0.075. With eighteen points neither effect holds, and the recomputation on the metric grid even flipped the sign for water.
The name comes from agricultural subsidy records. They list every declared parcel with its use, and “tree nurseries” is a value of its own among them. Not inferred from the spectrum, but declared by the holding itself and maintained by the paying agency. The layer is openly available; I checked its licence word for word on 9 August and entered it in the source register. First the line in the register, then the line in the script. That is what my own rules say.
In the view of this instalment there are 8,671 declared parcels in 79 categories of use. 1,192 of them are tree nurseries, 1,043 hectares in total. After mown pasture and silage maize that is the third most common use in the area. Nine hand-picked points thus become more than a thousand areas that bring their own name with them.
I lay the parcels onto the same 20 metre grid and ask for each one individually how it came through the drought summers. Two precautions belong to this. Only cells whose four neighbours belong to the same parcel count, because a cell on the boundary mixes both sides, and behind a nursery boundary there is almost always grassland. And a parcel needs at least twelve such core cells, the same evidence threshold as the map above. What remains are 281 nursery parcels, 1,966 grassland parcels and 2,067 arable parcels.
| Use | Parcels | NDVI normal | Decline green | Decline water |
|---|---|---|---|---|
| Tree nurseries | 281 | 0.638 | −0.038 | −0.054 |
| Grassland (mown pasture, meadows) | 1,966 | 0.787 | −0.106 | −0.169 |
| Arable (maize, cereals, field grass) | 2,067 | 0.776 | −0.035 | −0.058 |
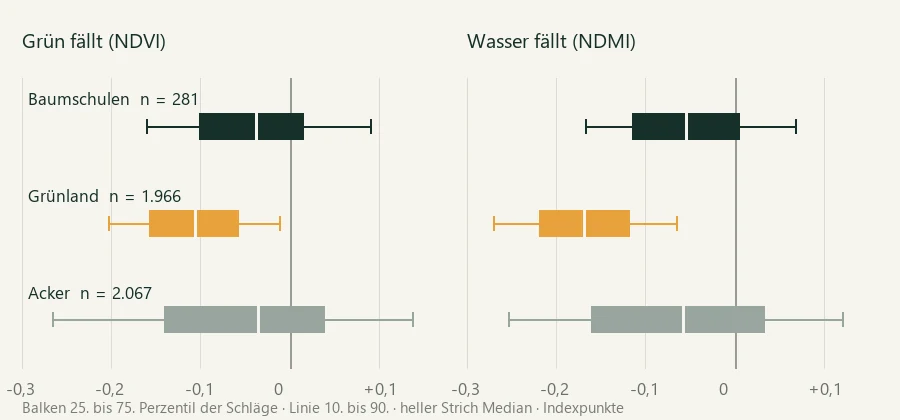
How the three uses come through the drought summers
- tree nurseries, 281 parcels.
- grassland, 1,966 parcels.
- arable land, 2,067 parcels.
Not the means, but the spread: the thick bar covers the middle half of the parcels, the thin line nine tenths, the light mark sits on the median. That also shows how far the classes overlap, and they do so amply.
The yardstick has to be measured anew here. The 0.075 points from above apply to a single 20 metre cell. Averaged over a whole parcel, less should remain, and for grassland that is indeed the case: 0.085. On nursery parcels it is 0.121, on arable land 0.191. That is not measurement error, that is management. A nursery block is cleared and replanted; an arable field carries two different crops in two years. Anyone comparing these parcels is comparing more restless objects than the map above suggests.
And now it holds. The tree nurseries fall 0.068 points less than the grassland next door in green, and 0.115 less in water. That is the same effect eighteen points could not carry, only twice as large and this time with a number behind it: the 95 per cent interval runs from 0.056 to 0.076 in green and from 0.097 to 0.123 in water.
For the interval I had to do something that matters more than it sounds. The resampling is not over parcels but over field blocks. What lies on one field block shares soil, holding, irrigation and cloud; two thousand parcels are not two thousand independent cases. Drawn over parcels, the interval would have come out distinctly narrower, and would have lied by exactly that difference.
With that the instalment would have its answer: tree nurseries come through the drought better. Irrigated crops, more deeply rooted woody plants, smaller parcels, all of it plausible. I then put two questions to that answer, and the first one turned it around.
Arable land comes through just as well. Maize, cereals and field grass fall 0.071 points less than grassland in green and 0.111 less in water, so practically the same as the tree nurseries. Set nursery against arable land and nothing remains: 0.003 points in green, 0.004 in water, both squarely inside the noise.
So the finding does not belong to the tree nurseries. It belongs to the grassland. Not “the nurseries hold out”, but “the pastures collapse, and nothing else does”. That is the less conspicuous story, and it is the one that stands in the data.
The second question was the most obvious objection: nurseries start paler, 0.638 against 0.787. What starts high has more room to fall. So the same comparison again, but only between parcels with a similar starting green. In green the advantage then almost completely disappears; in the bands between 0.65 and 0.80 it is zero. In water it remains, between 0.04 and 0.07 points. Arable land, by contrast, beats grassland at equal height as well, across six bands and by 0.06 in green. So saturation alone does not explain the hole in the grassland.
The map above says the same thing from the other side. Declared tree nursery land makes up 3.0 per cent of the analysed area. Of the 965 clusters in the class “moisture falls, green does not”, eight lie on a tree nursery. By pure chance there would have been 29. So where the map swings out most strongly, tree nurseries are a good three times rarer than elsewhere, and the nine circles on the map accordingly lie almost entirely in the pale field. I looked at the six strongest moisture clusters individually in the aerial photograph: five are pastures, arable fields, parcels between hedgebanks; the sixth is a row crop of young woody plants at the forest edge. Whether tree nursery, afforestation or Christmas tree plantation, the image does not decide.
One thing has to be read along by everyone who carries these numbers further. The layer shows declared use, not land cover. Whoever does not apply for agricultural support does not appear in it. And that hits precisely the most intensive form of horticulture.
The test for that is already at hand. Of the nine nursery blocks I confirmed by hand in the aerial photograph, exactly one carries a declared parcel with the value “tree nurseries”; for three there is one within forty metres. Two are declared as “all other areas, not agricultural land”, four carry no declared parcel at all. If I look at those four in the aerial photograph, what stands there are polytunnels, container standing areas and covered blocks. Which is precisely what, in the logic of subsidy, is not agricultural land.
The 281 analysed parcels are therefore not “the tree nurseries of the Ammerland”. They are the open-ground blocks among them that are declared as agricultural land. For a drought question that is probably the more interesting half, because whatever stands under film or in a container is watered anyway. All the same, only something about them is being claimed.
The layer brings a second limit with it: only the application years 2025 and 2026 are available, there is no open archive. Over the summers of 2018 and 2022 therefore lies a present-day land-use layer, and the further back a year lies, the more parcels have changed use since. That is why I also computed both drought years separately. In 2018 the tree nurseries fall by 0.039 points in green, in 2022 by 0.031; the grassland by 0.139 and by 0.064. The pattern stands in both years, and more clearly in the older one.
And the aerial photograph has an additional weakness here that I have to name: unlike in Oldenburg, the service does not release a flight date for this area. I therefore use it only for the question of what kind of area lies there. Rows and polytunnels do not disappear within three years. For dating a change it is useless without a date.
Context What the number does not say
Back to the three hundred and sixty hectares. The statistics count tree nursery area, that is, area on which a holding declares nursery crops in the survey year. That figure can fall for very different reasons, and the survey names none of them.
A holding gives up, and the neighbour turns it into grassland. A holding switches from open ground to containers and needs fewer hectares for it. A holding shrinks because sales collapse; nursery stock is a long-term investment, and whoever builds plants last. A holding loses stock in the drought. From above the first three cases look the same, and the fourth looks like nothing at all if replanting has taken place.
One calculation on this, which explains nothing but puts the order of magnitude in place: between the surveys eleven holdings disappear. At an average holding size of 16.3 hectares that is around 180 hectares, half of the decline. The other half must be holdings that stay and shrink. Neither of these two processes has to have anything to do with the weather.
What is supported by the data instead are two other things, both less conspicuous than the headline. First: across eight summers this landscape becomes measurably drier in the drought years without its colour changing substantially. Anyone measuring drought by colour, and that is what most quick maps do, sees nothing over the Ammerland in 2022. Second: where the decline in green really sits is not the tree nursery but the pasture.
And one more thing that cannot be measured and has to be thought along: whoever stays green in a drought often did not get that for free. Green can be irrigation, that is, water from the ground, that is, a permit, a meter, a price. The satellite sees the result and never the price. Whether the pale areas on this map came through the drought well or were merely well supplied stands in no pixel. That is exactly what makes the finding above ambiguous: that tree nurseries and arable land hold and the pasture does not may mean that they endure more. It may also mean that somebody switched on the pump for them.
0 m The first step
What this is aboutthe question before the answer.
What stands in the waythat a good map convinces even when it shows the wrong area.
The first stepgo there and ask the four nursery blocks that appear in no register.
The official land-use layer opened the gate, but in doing so it revealed a new gap. Four of the nine blocks that are unmistakably tree nurseries in the aerial photograph do not appear in the register of declared parcels at all, and two more only as “not agricultural land”. These are not edge cases; these are the polytunnels and container areas: the part of horticulture that needs the most water and looks the least like farming.
This gap cannot be closed from above. No index distinguishes a container standing area from a storage yard, and a register in which somebody does not appear does not become more complete through more computing time. The next reliable information comes from the holdings themselves: how much area stands under film today, what has been given up since 2018, and what the summer of 2018 cost. That is an appointment, not a script.
What remains open from a distance
Three things I cannot do, and more computing time changes none of them.
Name every area. The official layer names 1,192 nursery parcels, and that carries the numbers above. But it only names whoever applies for agricultural support. Whatever stands under film and in containers remains invisible, and that is precisely the part that matters most where water is concerned.
Separate the cause. Closure of a holding, conversion to containers, a sales crisis and drought damage all look the same from orbit. Anyone drawing a cause for the 360 hectares out of this analysis brought it with them.
See the price. Irrigation is invisible from above. An area that stays green and an area that is kept green are the same thing in the image.
The next step is therefore not one that can be computed. Go there, ask, look, with the people who know their blocks and know what 2018 cost. That will come as an instalment of its own. Until then, what stands here is what can be supported from above, and what precisely does not follow from it. When is a map good enough to claim something?
Anyone wanting to lay the layers on top of each other themselves (time series, indices, different grid widths over the same landscape) will find the workbench in the layer explorer.
The question of this instalment can be reproduced there: take two summers, lay them on top of each other and watch how the picture changes depending on which index you choose. The interfaces are in German.
See for yourself
Lay two summers on top of each other in the scene explorer · follow the weekly maps in the NDVI monitor · look up the source and licence of every layer in the connector catalogue.
Methods & sources
The recurring procedures of the Feldbuch are explained centrally, once: median composites with cloud mask, the metric analysis grid, evidence thresholds and the aerial-photograph cross-check with three separate dates are set out on the page How the maps are made. Here stand the parameters of this instalment; every load-bearing number lies in an open data file. Scripts and data files are versioned on GitHub: github.com/retteten/fieldbook-code. The paths below are paths in that repository.
- Summer composites: Sentinel-2 L2A via the
CDSE Processing API · for each year 2018–2025 a median
composite of ISO weeks 23–35 (June to August), with clouds,
shadows and snow removed via the scene classification
(SCL classes 3, 8, 9, 10, 11) · three bands: NDVI (B04/B08),
NDMI (B8A/B11), number of observations; both indices from
the same acquisitions · analysis grid 20 m, WGS 84 / UTM 32N
(EPSG:32632), cell area exactly 400 m²; 884 × 1014 cells,
bounding box snapped outwards onto the grid (UTM
424,360–442,040 east, 5,885,960–5,906,240 north ≙
7.865–8.134 E / 53.118–53.302 N), view 17.7 km wide ·
scripts/ortstermin/duerre_baumschulen.py, raw data retrieved 12 August 2026 · observations per cell and summer across the five years used: minimum 2, median 11, maximum 22. The minimum occurs in edge and cloud situations of individual years. - Winter composites (identity test): the same chain, window 1 February to 20 March in 2021 and 2025 · raw data retrieved 12 August 2026 · result: a single-peaked winter distribution (peak 0.57 in both years); a threshold that would leave exactly the official 2,252 hectares would sit at NDVI 0.758.
- Analysis (quadrants and clusters):
processed on 12 August 2026 with exactly this call:
python scripts/ortstermin/duerre_auswertung.py
                            --duerre 2018,2022 --normal 2021,2024,2025
                            --rauschpaar 2021,2025
                            --json docs/daten/duerre-ammerland-2026-W33.json
· noise floor from the year pair 2021/2025: σ 0.0747 (NDVI) and 0.0856 (NDMI); threshold per index 2 σ → 0.1494 and 0.1712 · analysed area 864,264 land cells = 34,570.6 hectares; water excluded via NDVI > 0.25 · clusters from 12 contiguous cells (0.48 ha); on the map colour is only carried by a patch of 4 cells or more, conspicuous single cells appear as pale indications and enter no number · area figures from pixel counts, without a formal error estimate · data: docs/daten/duerre-ammerland-2026-W33.json. - Hand sample: 20 points (9 tree nursery,
9 grassland/arable, 2 woodland), determined individually in
the DOP20 on 9 August 2026; measured values redrawn on the
metric grid on 12 August 2026:
python scripts/ortstermin/duerre_stichprobe.py
                            --json docs/daten/duerre-ammerland-stichprobe.json
· per point the mean of a 60 m window (3 × 3 cells) · data: docs/daten/duerre-ammerland-stichprobe.json. - Official land-use layer (IACS declared parcels):
WFS agrar_ant of the SLA Niedersachsen, layer
view_26_s_akt (application year 2026), plain-text
attribute nc_festg_txt · retrieved on 13 August 2026
in EPSG:32632 over the bounding box of this instalment, paged
at 1,000 features with a fixed sort order · 8,671 parcels, 79
categories of use, among them 1,192 tree nurseries (1,043 ha
declared), 3,040 mown pastures (6,680 ha) and 1,669 silage
maize (5,678 ha) · rasterised onto the same 20 m grid; only
core cells count (all four neighbours in the same parcel) and
only parcels with at least 12 core cells (0.48 ha) · per
parcel the median over its core cells ·
scripts/ortstermin/duerre_schlaege.py, callpython scripts/ortstermin/duerre_schlaege.py --duerre 2018,2022 --normal 2021,2024,2025 --rauschpaar 2021,2025 --json docs/daten/duerre-ammerland-schlaege.json· data: docs/daten/duerre-ammerland-schlaege.json. - Parcel comparison (statistics): difference of the medians, confidence interval from a bootstrap with 5,000 draws over field blocks (FLIK), not over parcels: 259 nursery against 1,761 grassland field blocks · additionally Mann-Whitney U in normal approximation with tie correction (nursery against grassland: p < 10⁻²⁷ in green, p < 10⁻⁶⁷ in water; nursery against arable: p = 0.97 and p = 0.53) · noise floor per parcel from the year pair 2021/2025: 0.121 (nursery), 0.085 (grassland), 0.191 (arable) NDVI · equal-height cross-check in NDVI bands of 0.05, counting only bands with at least 10 parcels per class · robustness test with 4 and 25 core cells instead of 12: green +0.068 and +0.059, water +0.112 and +0.103 · all figures in the same data file.
- Climate context (DWD): CDC monthly grids
(1 km) for precipitation, potential evaporation and soil
moisture, area mean over the bounding box of this instalment,
summers 1991–2025 ·
scripts/klima/duerre_kontext.py, retrieved 9 August 2026 · data: docs/daten/klima-ammerland-1991-2025.json · “Data source: Deutscher Wetterdienst, grid data reproduced graphically.” - Map frame (new on 13 August 2026): every
map in the Feldbuch now carries a graticule, scale bar,
north arrow and CRS stamp inside the image itself
(
scripts/ortstermin/kartenrahmen.py). The graticule lines are true geographic lines: each is projected into the analysis CRS at 33 support points, because a meridian is tilted on a UTM map and a straight line here would be off by up to 200 metres. The north arrow points to grid north; the meridian convergence against geographic north is given as a number in the footer (here 0.8° west). The scale bar is exact because the image lies in a metric CRS. - Aerial overview (locating): LGLN DOP20 over the same bounding box, obtained on 13 August 2026 in EPSG:25832 (the same projection as the analysis grid, datum offset under one metre), 1,200 × 1,376 pixels ≙ roughly 15 m per pixel. Deliberately coarse: an overview image, not evidence. For evidence the tiles in identitaet.webp are there.
- Aerial photograph (identity image and inspection): LGLN DOP20, three dates kept separate. Flight: the service does not supply one for this area (the info layer answers empty; in Oldenburg the same query works); publication: therefore not attributable either; retrieval: 9 August 2026 (inspection of the sample points) and 12 August 2026 (image tiles). Precisely for that reason the aerial photograph here serves only to determine the type of area, not to date it.
- Figures from the first calculation: the threshold table of the gate (4,783 / 6,528 / 9,084 ha) and the range of the four year pairs (0.056–0.076 NDVI) come from the first calculation of 9 August 2026; analysis grid: geographic raster (EPSG:4326), nominal width 20 m at the mid-latitude; area figures therefore underestimated by about one per cent. These two calculations have not been repeated on the metric grid; they are marked as first calculation.
- Attribution: Contains modified Copernicus Sentinel data (2018–2025). The German wording on the images is explanatory.
- Tree nursery survey of the State Statistical Office of Lower Saxony: in 2021, 160 holdings on 2,612 hectares in the district of Ammerland; in 2025, 149 holdings on 2,252 hectares. Across the state the nursery area falls in the same period from 4,794 to 4,060 hectares (around 15 per cent). The survey takes place every four years and gives no reasons for changes in area.
- Own analysis: Sentinel-2 L2A via the Copernicus Data Space Ecosystem. Eight peak-season composites (ISO weeks 23–35) of the years 2018 to 2025 plus two late-winter composites (1 February to 20 March in 2021 and 2025), analysis grid 20 metres (WGS 84 / UTM 32N, EPSG:32632), view 7.865–8.134 east / 53.118–53.302 north (snapped outwards onto the grid). NDVI from B04 and B08, NDMI from B8A and B11, both from the same acquisitions and the same cloud mask. Every pixel is a median over cloud-free observations: median 11 per summer, never more than 22; in edge and cloud situations of individual years as few as 2. Method and limits: methods page and map records above; scripts and data on GitHub. Contains modified Copernicus Sentinel data (2018–2025).
- Thresholds: robust spread of two unremarkable summers against each other (2021 against 2025), 0.0747 NDVI and 0.0856 NDMI; threshold twice that in each case. Four year pairs examined gave 0.056 to 0.076 NDVI in the first calculation; the strictest is the one used. Figures: docs/daten/duerre-ammerland-2026-W33.json.
- Climatic context: Deutscher Wetterdienst, CDC OpenData, monthly grids (1 km) for precipitation, potential evaporation (AMBAV, over grass) and soil moisture (% of usable field capacity under grass), summers June–August 1991 to 2025, area mean over the view of this instalment; climatic water balance = precipitation minus potential evaporation. “Data source: Deutscher Wetterdienst, grid data reproduced graphically”, CC BY 4.0, https://creativecommons.org/licenses/by/4.0/deed.en, data modified (spatially averaged, summed seasonally); retrieved on 9 August 2026 via opendata.dwd.de. Method: scripts/klima/duerre_kontext.py, figures: docs/daten/klima-ammerland-1991-2025.json.
- Hand sample: 9 tree nursery blocks, 9 grassland and arable areas, 2 woodland areas, each determined individually in the DOP20 on 9 August 2026; measured values redrawn on the metric grid on 12 August 2026. The measured value per point is the mean of a 60 metre window. Coordinates and individual values: docs/daten/duerre-ammerland-stichprobe.json. It is a hand-picked selection, not a random sample, and it carries no significance.
- Geobase data: © LGLN (2026), digital orthophotos DOP20, CC BY 4.0, https://creativecommons.org/licenses/by/4.0/deed.en, extract, data modified. Obtained on 9 and 12 August 2026 via the open service of the LGLN (opendata.lgln.niedersachsen.de). The service does not supply a flight date for this area; the aerial photograph is therefore used only to determine the type of area, not for dating.
- Official land-use layer: IACS declared parcels of the SLA Niedersachsen (WFS agrar_ant, layer view_26_s_akt, attribute nc_festg_txt, application year 2026), retrieved on 13 August 2026. “© ML/SLA Niedersachsen/CC BY 4.0”, https://creativecommons.org/licenses/by/4.0/deed.en, extract, data modified (rasterised onto the 20 metre grid). The licence has been checked word for word since 9 August 2026 and entered in the source register. Two limits apply to every number that comes from this layer: it shows declared use, not land cover, and only the application years 2025 and 2026 are available, so a present-day land-use layer is being used for the drought summers. Coverage test against the nine hand-confirmed blocks: one carries a tree nursery parcel, for three there is one within 40 metres, two are declared as “all other areas (not agricultural land)”, four carry no declared parcel at all.